STUDY GROUP
INFOGRAPHICS | 2015
TURNING RESEARCH INTO VISUAL NARRATIVES
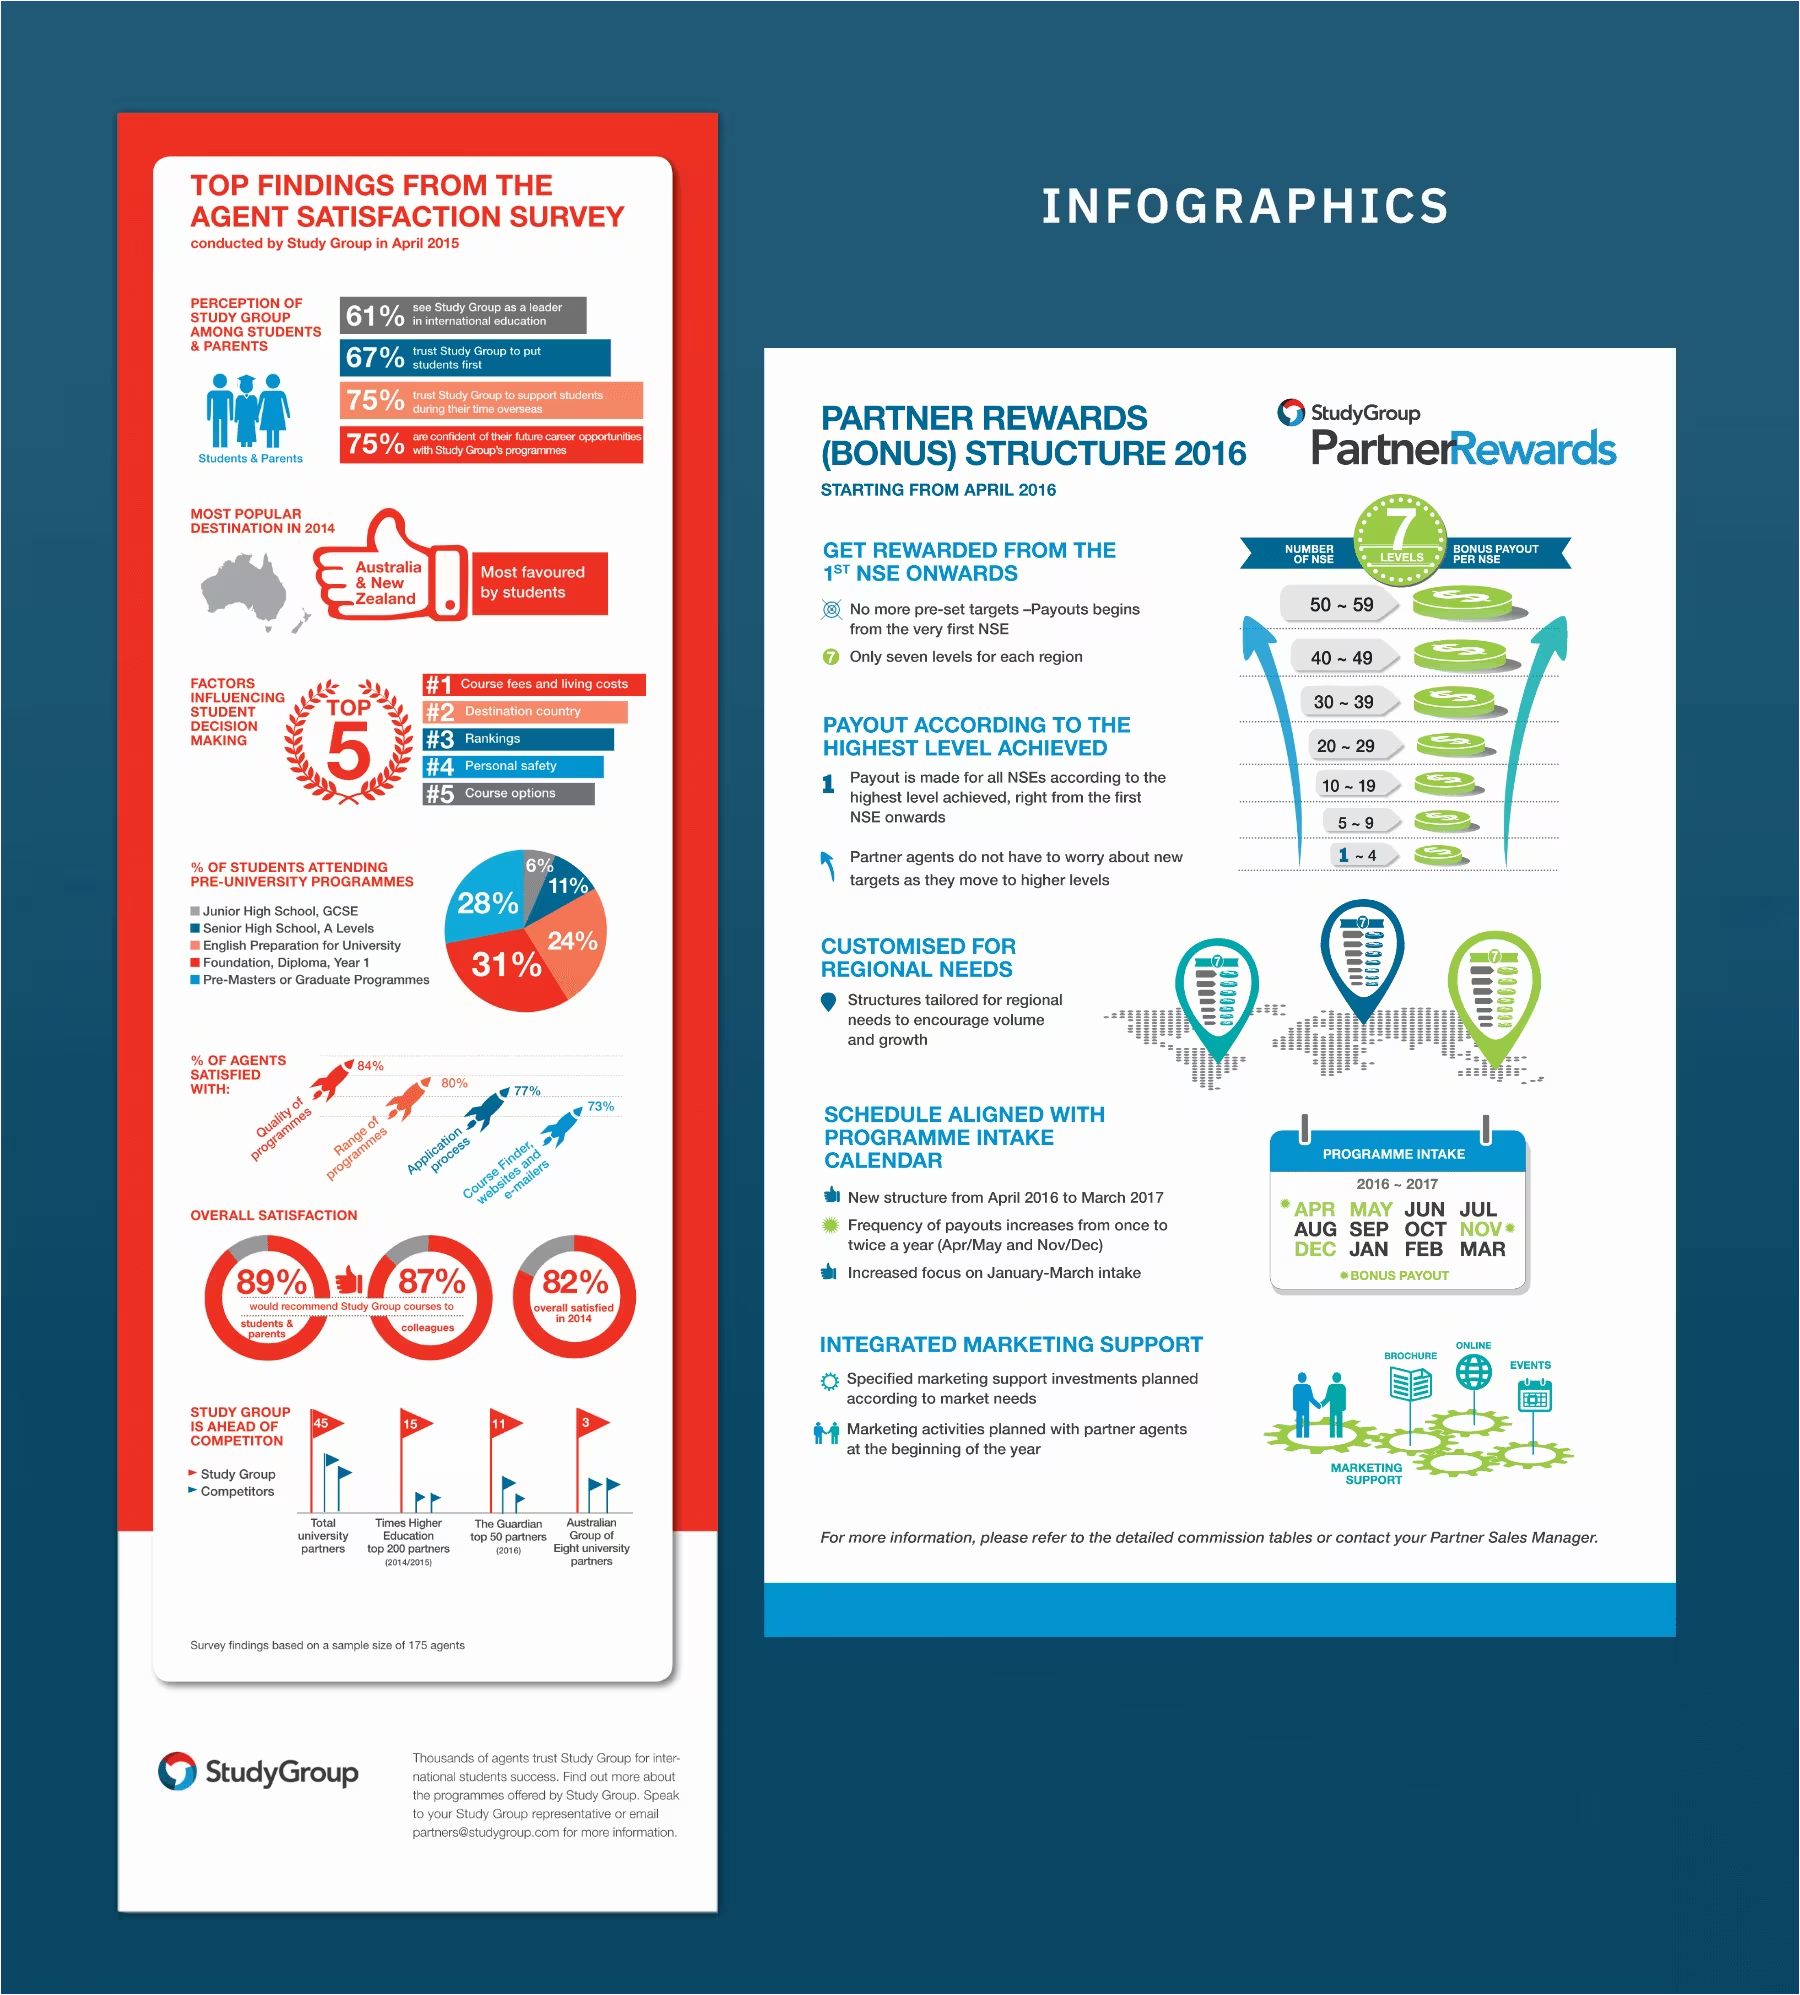
Numbers, facts and findings become far more engaging when they are presented visually. Through a thoughtful blend of icons, illustrations, charts and information hierarchy, infographics transform complex information into stories that are easier to navigate, understand and remember.
Study Group, a global leader in preparing students for international academic success and rewarding careers, commissioned us to visualise their survey findings and editorial features. By carefully distilling the research into a series of engaging infographics, we helped readers absorb key insights at a glance while bringing clarity, rhythm and visual interest to every page.
Because the most effective infographics transform complex information into visual narratives that are engaging and easy to understand.